A Hitchhiker's Guide to the FFT
VI. Recovering the Continuous Fourier Transform
Despite all the good results presented in the previous sections, the results given by the fft are far from looking any close to the actual Continuous Fourier transform that we are interested in. Hence the term fft (for Fast Fourier Transform) can be a bit confusing since it does not return the Fourier Transform but returns the Discrete Fourier Transform instead. When solving mathematical problems, one is often interested in the Fourier Transform (and not the discrete Fourier Transform...). Hence the output of the fft has to be modified in order to approximate the Continuous Fourier Transform presented in Figure 2.
VI.1 Adaptation of the frequency axis
First of all, according to Section III.1, the frequency axis has to be scaled to pass from \(k\) to \(\omega\). This can be done by typing:
omega_fft=2*pi*k_fft/P;
But in Figure 2, the frequency values are also ''centred'' around zero. Hence our axis also needs to be centred. This can be done by typing:
omega_fft_centred=unwrap(fftshift(omega_fft)-2*pi);
Finally, according to Section IV, the frequency axis needs to be scaled again in order to pass from \(\omega\) to \(\Omega\). In order to do so, we need some information about the function we want to take the Fourier Transform of. In particular, we need to know with what sampling interval \(T\) it has been sampled. If \(T\) is known, we can scale our frequency axis by typing:
T=eta_sampled_good(2)-eta_sampled_good(1);
OMEGA_fft=1/T*omega_fft_centred;
VI.2 Adaptation of the result vector
First of all, in order for it to look more like the Continuous Fourier Transform, the output vector X_fft has to be centred. This can be done by typing:
X_fft_centred=fftshift(X_fft);
Finally, according to Section IV, the output vector also needs to be scaled. This can be done by typing:
CFT_approx=T*X_fft_centred;
VI.3 Comparison between the numerical result and the analytic Fourier Transform
Let us compare the two by plotting them on the same graph. This can be done by typing:
plot(OMEGA,Fc,'b');
hold on
stem(OMEGA_fft,CFT_approx,'r');
hold off
xlabel('Omega');
legend('Fc(Omega)','CFT_approx');
title('What fft looks like after modifications');
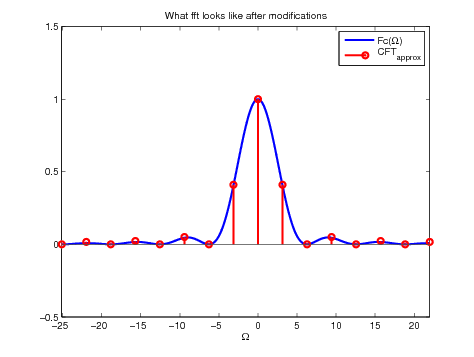
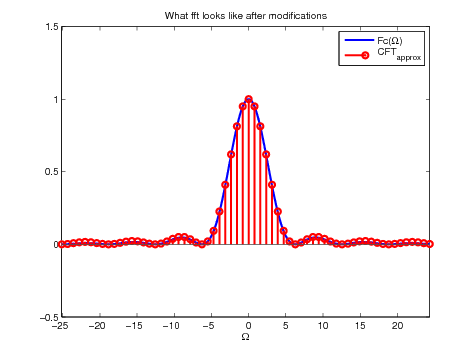
The following picture shows the results and shows that yes, it is possible to approximate a continuous Fourier transform with the Matlab fft routine. However the procedure is not trivial, and one should think (or read this note!) before using it.


Figure 13. Comparison between the analytic CFT and the approximation obtained
using fft, for \(P= N = 16\) (left) and \(P = 4 N\) (right)
